Weather data is transforming pest management in agriculture, making it precise and data-driven. Integrated Pest Management (IPM) tools now use real-time weather information to predict pest life cycles, disease outbreaks, and optimal treatment windows – helping farmers save money, reduce pesticide use, follow federal pesticide laws, and protect crops. Key tools include:
- NEWA (Network for Environment and Weather Applications): Offers free IPM models using data from 700+ grower-owned weather stations. Helps save $19,500 annually on sprays and prevents $264,000 in crop losses per farm.
- Predictive Pest Models: Platforms like USPest.org and Pest Prophet use temperature, humidity, and other variables to forecast pest behavior and disease risks. These tools align treatments with critical pest stages.
- Growing Degree Day (GDD) Calculators: Track heat accumulation to predict biological events like egg hatching. This method is more reliable than calendar-based schedules.
Each tool has its strengths and challenges, from costs and maintenance to data accuracy and coverage limitations. Combining these tools can reduce pesticide use by 30–40% and improve yields by up to 20%. For farmers, selecting the right tools depends on farm size, budget, and crop needs.
Using the Network for Environment and Weather Applications (NEWA) for Crop Modeling and IPM
sbb-itb-c4006de
1. NEWA (Network for Environment and Weather Applications)
NEWA operates an extensive network of over 700 grower-owned weather stations, strategically placed on farms across 15 partner states in the Northeast and Eastern U.S., including Massachusetts. Unlike systems that depend solely on airport data, NEWA collects real-time data directly from field sensors. It combines this on-farm data with NOAA observations and National Weather Service forecasts to power 30 different IPM (Integrated Pest Management) and crop production models.
Real-Time Data Collection
NEWA processes hourly readings from sensors measuring temperature, humidity, precipitation, wind, and leaf wetness. If a station goes offline or its sensors fail, automated quality control kicks in immediately. Missing data is filled using nearby sensor readings and grid data from the National Centers for Environmental Prediction. For stations lacking leaf wetness sensors, NEWA logs a "wet hour" whenever relative humidity exceeds 90%. To improve accuracy, the platform adjusts airport-based humidity data using a specific formula (adjRH = RH / (0.0047*RH + 0.53)), ensuring the data reflects actual farm conditions.
Predictive Accuracy
In 2007, apple, grape, onion, and potato growers in New York and the Northeast began using NEWA’s forecast models to guide their spray programs. By following expert recommendations, they reported saving an average of $19,500 annually on spray costs and preventing $264,000 in annual crop losses per farm. The system’s 5-day risk forecasts allow growers to time pest control applications precisely, targeting pests when they are most vulnerable and removing the guesswork.
Integration with IPM Systems
NEWA enables growers to create custom profiles where they can log "biofix" dates – the first observed instance of a pest or disease symptom. These biological markers are then synced with local weather data, producing highly specific predictions tailored to each farm. The platform supports pest management tools for issues like Cabbage Maggot and Grape Berry Moth, as well as disease forecasts for Apple Scab and Fire Blight. Additionally, users can download up to 12 months of hourly or daily weather summaries for record-keeping or insurance purposes.
Environmental and Cost Benefits
NEWA provides free access to all its IPM tools, degree-day calculators, and crop models. The only expense for growers is the purchase and upkeep of a compatible weather station, such as those from Onset or KestrelMet. In a 2017 survey, 100% of users said they would recommend NEWA to other growers, and 99.2% noted a positive impact on their IPM practices. To ensure accuracy, station owners are encouraged to perform sensor tune-ups at least twice a year. Dan Olmstead, Digital Outreach and Development Coordinator at Cornell IPM, emphasizes the importance of regular maintenance:
"Accurate sensor readings are very important. Review this checklist at least twice a year to make sure your weather station is performing at its best".
NEWA’s strong performance demonstrates how weather-based IPM tools can enhance both environmental and economic outcomes for growers.
2. Predictive Pest Modeling Tools
Predictive pest modeling platforms refine Integrated Pest Management (IPM) strategies by combining real-time weather data, like that from NEWA, with pest biology. These tools translate raw weather information into practical insights, helping farmers make better decisions.
By converting temperature data into degree-days, these models track the biological development of pests and plants rather than relying on calendar dates, which can differ by 12–30 days for key events like egg hatching. The process typically starts with a biofix – often the first pheromone trap catch – which resets degree-day counts to align the model with actual pest activity.
Real-Time Data Collection
Modern platforms utilize vast networks of weather data to deliver hyper-local risk assessments. For instance:
- USPest.org pulls data from over 15,000 public weather stations, creating degree-day maps with an 800-meter (about 2,625-foot) resolution. This accounts for variations in terrain, elevation, and microclimates.
- Pest Prophet integrates public and private weather networks, including in-canopy sensors, providing hourly updates for over 420 models. These models cover insects, plant diseases, weeds, and crop growth stages, sending alerts when pests reach critical thresholds. This eliminates the need for constant manual monitoring.
Such detailed data allows for precise forecasting of pest behavior, making these tools indispensable for modern IPM practices.
Predictive Accuracy
The accuracy of these platforms directly influences decisions on spray timing and resource use. Pest Prophet, for example, offers two tiers of service:
- Professional tier: $9.99 per month per field, includes 14-day forecasts and unlimited models.
- Basic tier: Free, includes one model per field with 90 days of historical data.
These models use factors like temperature, rainfall, and leaf wetness to predict infection risks for pathogens like apple scab and fire blight. Some platforms even offer extended forecasts, such as 7-day National Weather Service updates and 7-month North American Multi-Model Ensemble projections, to aid in long-term planning.
Oregon State University highlights the value of degree-day models, noting they "can greatly increase precision of forecasting critical life stages and management events", making them a key component of IPM programs.
Integration with IPM Systems
These tools pinpoint optimal treatment windows, aligning actions like pesticide applications or biocontrol releases with the most vulnerable stages of pest development. As Pest Prophet explains:
"Integrating pest models can reduce spray applications, lower costs, and diminish resistance risk".
For maximum effectiveness, these platforms rely on accurate biofix dates derived from local field observations rather than generic calendar estimates. Hourly weather updates further enhance disease risk models, which are particularly sensitive to short-term changes in moisture and temperature.
3. Growing Degree Days (GDD) Calculators
GDD calculators, much like NEWA and predictive pest models, help growers make better decisions by using heat accumulation data to predict biological events instead of relying on fixed calendar dates. This approach highlights how biological events are driven by heat, not time. For instance, in Logan, Utah, the timing of codling moth egg hatch varied by over two weeks across three years – occurring on May 15 in 2005 but as early as April 30 in 2007. This variation underscores the shortcomings of calendar-based methods.
Predictive Accuracy
The reliability of GDD calculators depends on using temperature thresholds specific to each pest or crop. Most calculators use the Basic (Averaging) Method, where GDD is calculated as:
((Tmax + Tmin) / 2) – Base Temperature, with negative values set to zero. For many pest models, such as the cereal leaf beetle, a common base temperature is 50°F. To ensure consistent data, systems like UC IPM rely on backup stations and long-term averages to fill gaps in weather data. The UC IPM weather database, for example, stores daily data from about 350 weather stations across California, including NOAA-sourced data going back to 1951. Marion Murray, an Extension IPM Specialist at Utah State University, explains:
"Using degree days to time treatments is more reliable than a calendar date and allows growers to pinpoint a specific treatment date each year".
Accurate GDD calculations ensure timely and effective field interventions.
Integration with IPM Systems
GDD calculators are essential for Integrated Pest Management (IPM), helping to time scouting, trap placement, and insecticide applications. For example, MyPest Page combines GDD data with hourly weather-driven disease risk models to create a centralized pest management dashboard. Similarly, the USPEST.ORG database offers access to over 160 GDD-based species models, using real-time data from more than 15,000 weather stations across the U.S. and Canada. To align models with actual conditions, GDD accumulation begins at a biological trigger, such as the first pheromone trap catch, rather than relying on generic calendar estimates. Advanced features like push notifications and email alerts inform managers when specific GDD thresholds are reached. Additionally, the data can be exported in CSV format for integration into farm management software.
Environmental and Cost Benefits
By improving treatment timing, GDD tools not only enhance pest control but also reduce costs and environmental impact. These tools help growers apply treatments during the pest’s most vulnerable stages, such as egg hatching or specific larval instars, ensuring resources are used efficiently and effectively. Avoiding premature or late applications minimizes waste and maximizes impact. GDD data can also synchronize treatment schedules across farms, which is especially useful for managing mobile pests and limiting their spread between fields. Platforms like Agrio even provide hyper-local weather forecasts for GDD tracking with a resolution of about 1.9 miles (3 kilometers).
Pros and Cons
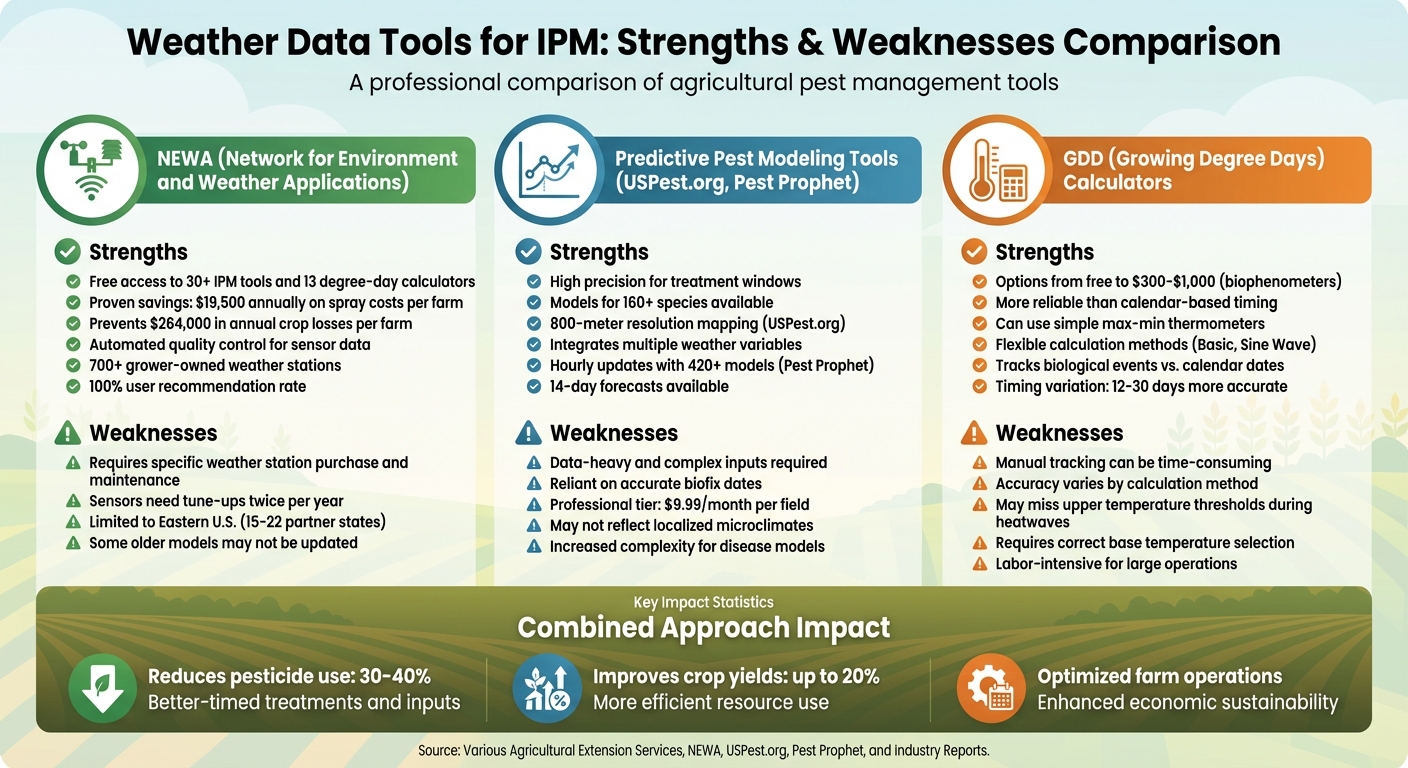
Comparison of Weather-Based IPM Tools: NEWA, Predictive Pest Models, and GDD Calculators
Each weather data tool for integrated pest management (IPM) comes with its own set of strengths and challenges. Choosing the right one depends on factors like your operation’s size, budget, and the level of precision you need.
NEWA stands out for its cost-saving potential. It provides free access to over 30 IPM tools and 13 degree-day calculators, which can reduce spray costs and crop losses by following label instructions. Plus, its automated quality control helps manage issues like sensor outages and missing data. However, there are trade-offs. Growers must purchase and maintain specific weather stations, which can be a recurring responsibility since sensors typically need tune-ups twice a year. Additionally, NEWA’s coverage is mostly limited to the Eastern U.S., with partnerships in 15 to 22 states.
Predictive Pest Modeling Tools are highly effective for identifying the best treatment windows. By aligning growing degree day (GDD) data with biological events like egg hatching or adult pest activity, these tools offer precision. For instance, platforms like USPEST.ORG provide models for over 160 species. The downside? These tools require detailed data inputs, especially for disease models that factor in variables like leaf wetness and humidity. Their accuracy also hinges on correct biofix dates, and they may struggle to reflect your field’s specific microclimate if using data from distant weather stations.
GDD Calculators offer flexibility, ranging from free manual methods to automated tools like biophenometers, which cost between $300 and $1,000. They’re a step up from calendar-based timing, with methods like the Sine Wave approach offering greater precision by modeling curved temperature profiles. However, manual tracking can be labor-intensive for large operations, and accuracy depends on selecting the right calculation method. Additionally, extreme heat events may cause these tools to miss upper temperature thresholds, impacting their reliability.
For a quick comparison, here’s a breakdown of the strengths and weaknesses of each tool:
| Tool/Technique | Strengths | Weaknesses |
|---|---|---|
| NEWA | • Free access to 30+ IPM tools and 13 degree-day calculators • Proven cost savings and reduced crop losses • Automated quality control for sensor data | • Requires specific weather station purchases and maintenance • Limited to the Eastern U.S. (15–22 partner states) • Some older models may not be updated |
| Predictive Pest Models | • High precision for determining treatment windows • Models available for over 160 species • Integrates multiple weather variables online | • Data-heavy and reliant on accurate biofix dates • Complexity increases for disease models • May not reflect localized microclimates |
| GDD Calculators | • Options range from free methods to advanced tools • More dependable than calendar-based timing • Can be used with simple max–min thermometers | • Manual tracking can be time-consuming • Accuracy varies by calculation method • May overlook high temperature thresholds during heatwaves |
Conclusion
Choosing the right tools for pest and crop management hinges on factors like farm size, budget, and crop type. For smaller farms or hobby growers, free platforms such as NEWA and USPest.org offer regional pest models without requiring additional hardware, making them practical and cost-effective solutions. These options highlight the importance of aligning tool selection with a farm’s specific needs and scale.
For those requiring hyper-local data, on-farm stations like the KestrelMet 6000 AG ($1,347.00) provide real-time insights that can significantly improve efficiency. Emile Guedon of Guedon Farms shared how monitoring rainfall and soil conditions across multiple fields helped cut down on unnecessary trips, saving both time and fuel:
"Considering the price of diesel and time wasted, fewer trips quickly offset the investment".
Specialty crops like apples, grapes, and berries benefit greatly from predictive pest modeling tools. These tools pinpoint precise treatment windows, offering a level of accuracy that has been shown to save costs and boost efficiency. Research supports the value of these integrated approaches, demonstrating measurable benefits for operations that adopt them.
Spray optimization tools, such as AgWeatherNet‘s Spray Guidance, take things a step further by identifying ideal 72-hour windows for pesticide application hazards. By focusing on wind speeds (4–10 mph) and Delta T values (3.6–14.4°F), these tools help reduce issues like drift and evaporation, which not only waste resources but also pose environmental risks. Jeremy DeLisle from the University of New Hampshire Cooperative Extension Service highlighted the importance of localized data for these applications:
"It’s good being in close proximity to that data, but even better having access to data directly from your farm".
The most effective strategy combines multiple tools: regional forecasts for broader planning, on-farm stations for precise microclimate data, and decision-support platforms tailored to specific pest models. This integrated approach allows farmers to reduce pesticide use by 30–40% and improve crop yields by up to 20%, thanks to better-timed treatments and inputs.
For those looking to refine their Integrated Pest Management (IPM) practices, additional resources like state-approved online training are available at Online Pest Control Courses (https://onlinepestcontrolcourses.com).
FAQs
How do I choose the right IPM weather tool for my crops?
When choosing an IPM weather tool, keep these factors in mind:
- Your specific requirements: Determine whether you need features like real-time weather updates, pest prediction models, or decision-making tools.
- Regional relevance: Make sure the tool relies on weather data tailored to your area.
- User experience: Opt for a platform that’s straightforward and works well with your farm’s existing systems.
Select a tool that aligns with your crops, geographic conditions, and overall management approach.
Do I need my own weather station for accurate forecasts?
Having a personal weather station gives you access to highly specific and accurate weather data right where you need it. This can be a game-changer for pest management. Weather can differ quite a bit over short distances, and having real-time, localized information means you can make decisions that are better suited to your exact conditions.
What’s the easiest way to set a biofix date correctly?
The simplest way to determine a biofix date is by noting a distinct, observable event in the pest’s life cycle or surroundings. This could be something like catching a specific number of pests in traps or a phenological event, such as when crops reach full bloom. Once this event is identified, record the date and start tracking degree days using the appropriate temperature thresholds. This approach helps ensure precise timing for pest management activities.